


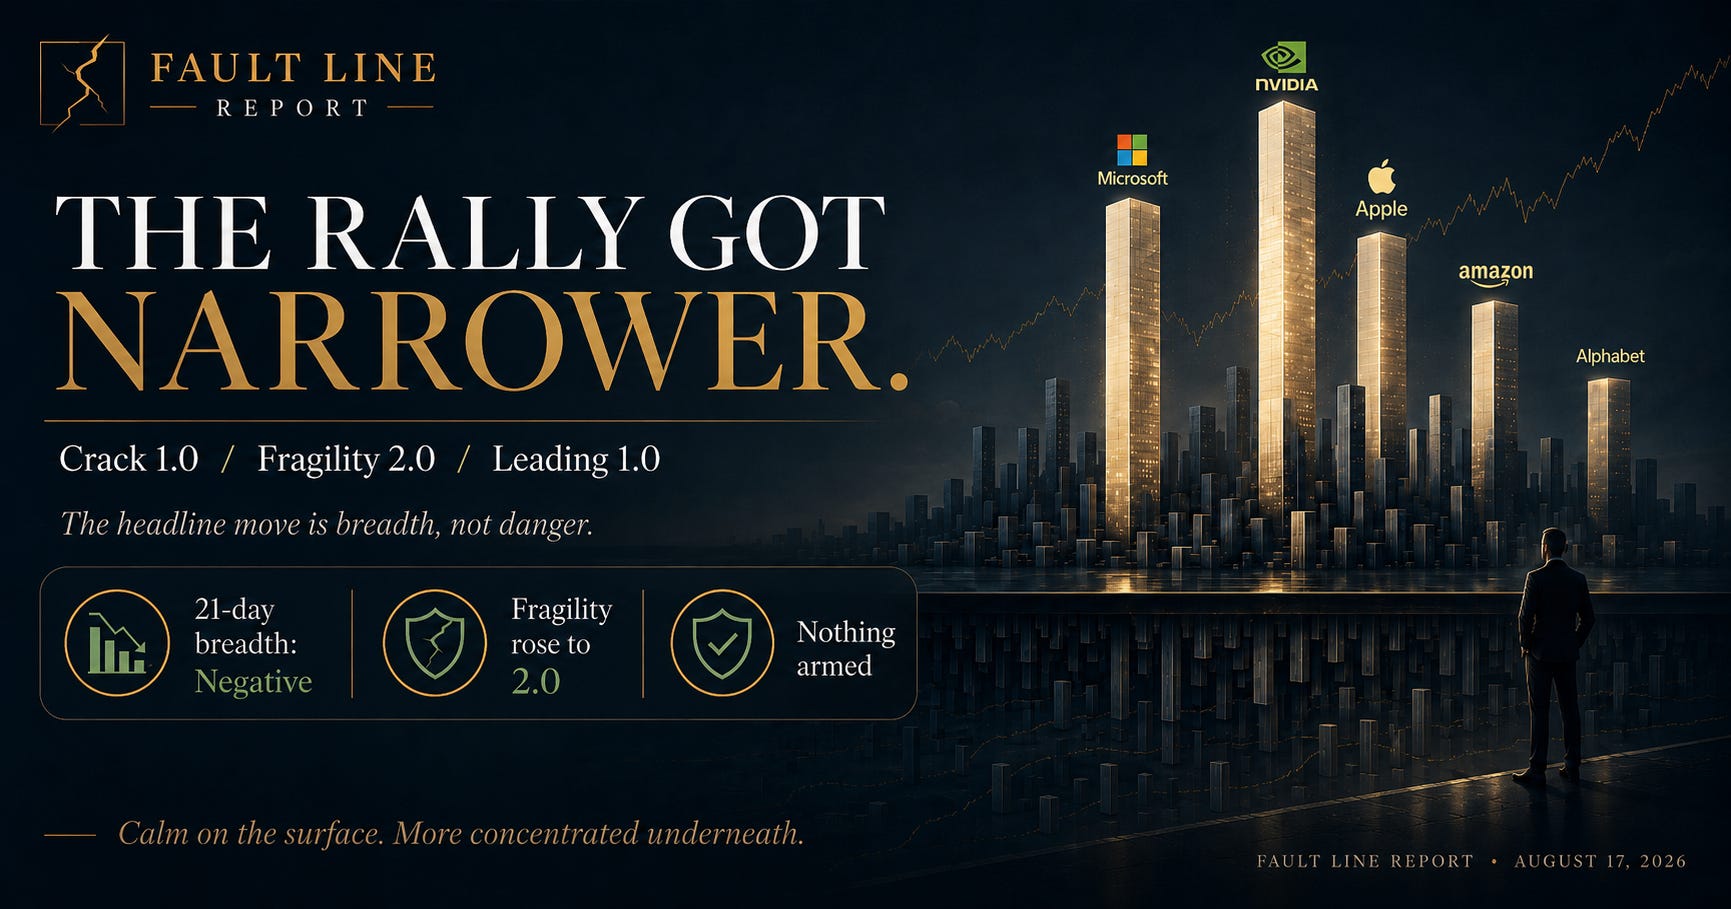
Crack 1.0. Fragility 2.0. Leading 1.0. Nothing here is close to armed — but one number moved today, and it’s worth understanding why.
The headline move is breadth, not danger. Twenty-one days ago, participation in this rally was wide — small caps, mid caps, and the broad market were all pulling their weight alongside the index. That flipped. As of this morning, the 21-day breadth reading has gone negative: the index is being carried by a shrinking set of large, cap-weighted names while the average stock underneath it goes quiet. SPY itself is basically flat — down a third of a percent off its recent peak, sitting at $775 — but the composition of that flatness changed. A market where ten names hold up the tape looks calm on the surface and behaves very differently underneath than one where five hundred names are pulling together.
That single shift is doing almost all the work in today’s scorecard. It pushed Fragility from 1.5 to 2.0 and Leading from 0.5 to 1.0 — the same signal hitting two different components, because a narrowing rally is both a near-term fragility marker (index looks strong, foundation doesn’t) and a longer-lead warning sign (breadth divergence is one of five inputs we track for early-cycle deterioration). Everything else on the board barely moved. Rates are flat. Credit spreads are tight and actually compressed slightly. VIX sits at 15 — nowhere near stress territory. The 30-year is still elevated above 5%, which is the one line that’s been sticky all month, but it isn’t new today.
Context, not a trigger. Our Leading Economic Index proxy — nine components rebuilt from free data since ISM doesn’t publish for free — still reads as broadly improving, 78 out of 100 on the diffusion index. That’s a genuine tension worth sitting with: the forward-looking economic data says things are fine, while the market’s internal structure just got a little more top-heavy. Those two facts aren’t contradictory so much as operating on different clocks. Breadth can thin for weeks or months before it means anything, or it can mean nothing at all — narrow markets have gone on to make new highs plenty of times. We’re flagging it because it’s the one real change in the data, not because it’s predictive on its own. (For what it’s worth: the framework’s own multi-year testing found score-based signals don’t reliably beat a buy-and-hold baseline for calling entries — see our methodology notes. This is a weather report, not a trading signal.)
Seasonally, we’re in the part of the year — May through October — that has historically run cooler than the other half of the calendar, and RSI on the S&P sits at a neutral 64, nowhere near the oversold territory that’s actually shown a repeatable edge in our testing. Nothing about today argues for urgency in either direction.
Where the tranches stand: all three main tiers remain unarmed and meaningfully far from trigger distance — the closest sits roughly 10% below current levels, the deepest tier closer to 30%. The fast, small-size tranche that exists specifically to catch quick or shallow selloffs is likewise quiet, sitting comfortably above its own 5% decline threshold. In short: the system is watching, not moving.
Bottom line: a market that looks calm from 30,000 feet just got a little more concentrated underneath. Worth watching if it persists into next week’s reading — worth nothing at all if it reverses by Wednesday. We’ll know more when we know more.
— Fault Line Report, August 17, 2026