


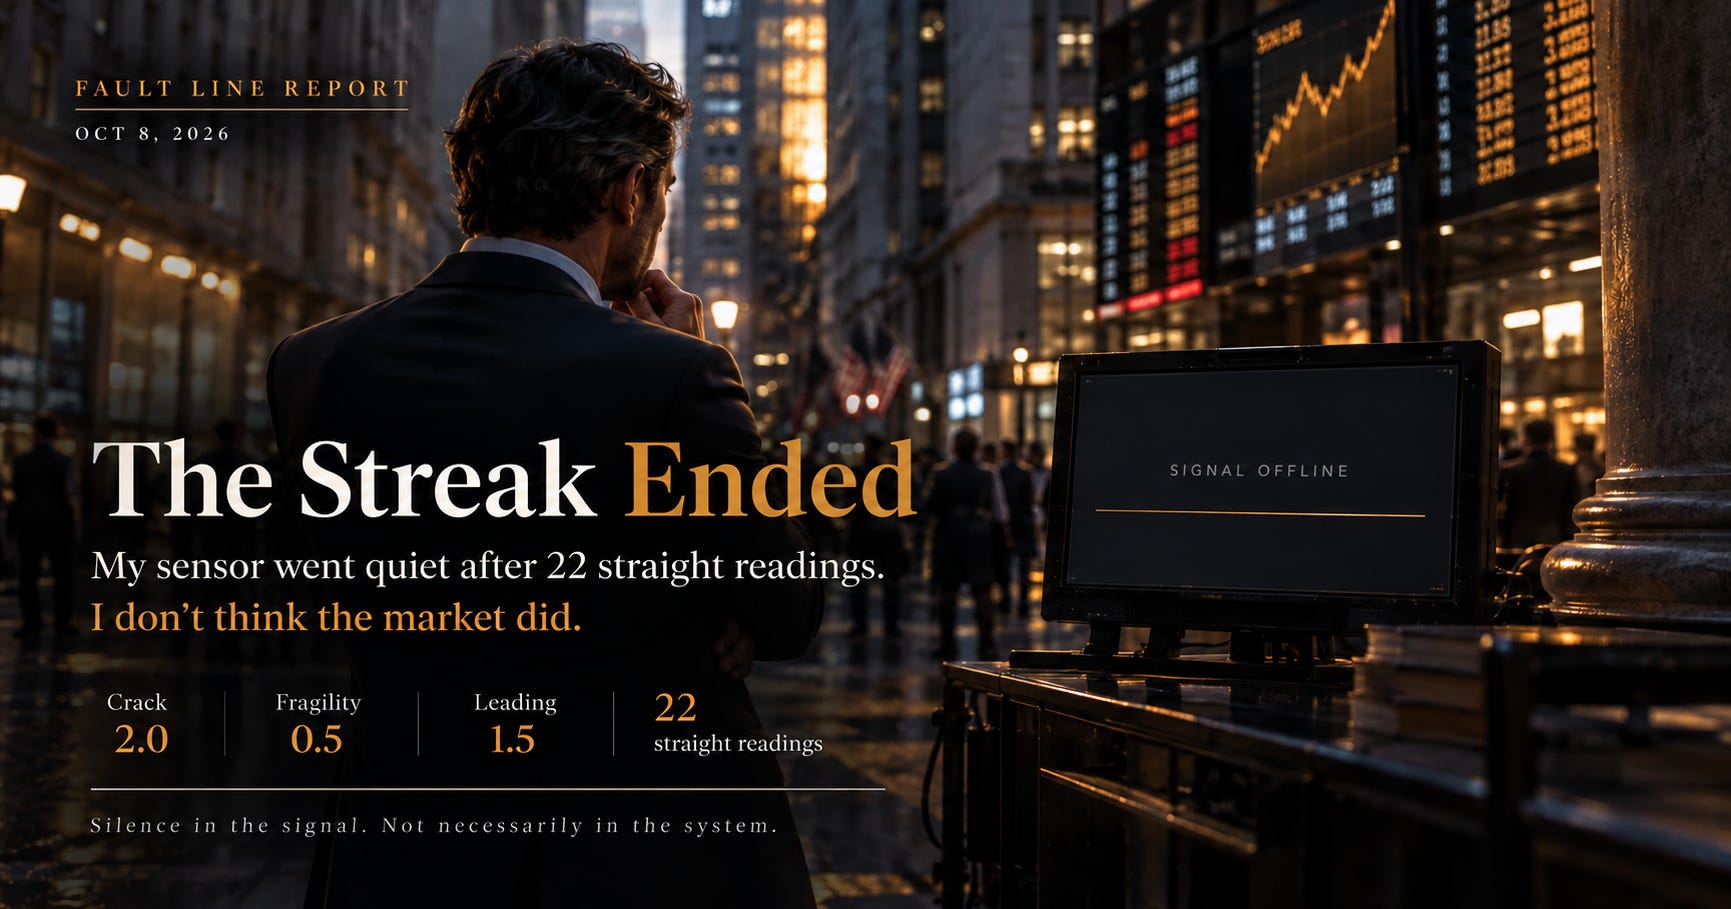
For more than a month, my shadow sensor showed the same four flags every day: rates, inflation, breadth and the leading indicators. Twenty-two clean readings in a row, the longest unbroken run I’ve tracked. This afternoon it dropped to three.
I’ll admit I felt a pull to call that good news. Fewer flags feels like less danger. I don’t think that’s what happened, and here’s why.
The flag that cleared was the leading indicators. Underneath, it came down to a few small moves. The gap between the 2-year and 10-year yields crept from 0.48 to 0.51 points, which tipped the yield curve from “flat” to “normal” by a hair. One of my breadth windows also stopped diverging. Neither is a new piece of information. They’re two numbers drifting across lines I drew months ago.
Meanwhile, the flags that matter most are still lit. The 30-year Treasury yield is at 5.67%, near a 24-year high. Brent crude is back above $103 after the latest Iran headlines. Wednesday’s Fed minutes said most officials expect another hike by year-end, and markets now price about 87% odds of one by December.
Credit, the place I look first for real trouble, is calm but twitchy. High-yield spreads went 310, 312, 303, then 309 basis points this week. That’s well short of anything I’d call stress, but it’s not tightening in a straight line either.
Stocks backed off from Tuesday’s records today. The S&P 500 is about 0.7% below its high, with oil and bond yields doing the pushing.
What I take from all this is that a sensor changing its answer isn’t the same as the market changing its mind. One quiet reading doesn’t reset anything. If it holds for a week, I’ll say so. If it flips back tomorrow, then today was noise, and that’s worth knowing too.
I’m watching the 30-year yield and credit spreads. Everything else follows from those.
October 8, 2026